Are you asking yourself, “Is there sufficient Airbnb demand in my area?” Studying the market demand is crucial for making the right decision.
The real estate market has been seeing a slight cooling off since last year due to the rising interest rates and uncertainties brought upon by the fluctuating economic conditions. There’s speculation that the US housing market will experience a mild crash anytime soon. However, the short term rental market is projected to remain strong despite expectations to the contrary.
Table of Contents
Traveler sentiments from all over the world remain positive, and many people are eager to travel despite the economic uncertainties. And since the rise of the home-sharing platforms in the late 2000s, people now prefer to stay in short term rentals over hotels. It is because of the former’s affordability and homey amenities. As a result, Airbnb owners are able to receive substantial income.
While short term rentals offer lucrative opportunities, some areas may not be optimal for investing in Airbnb. Before buying an investment property in your location, it’s important to determine whether there’s enough demand for short term rentals or not. It can significantly affect your success as an Airbnb investor.
The best short term rental markets are those that are frequented by travelers. When deciding whether your current area will make a good place for Airbnb rentals, you also need to consider the seasonality of tourism in your place. The more often visitors flock to your area, the higher the demand for Airbnb rentals will be.
The question is, how do you find Airbnb demand in your area? Let’s explore the most effective ways to determine the current Airbnb demand and historical trends.
What Is Airbnb Demand?
When carrying out a real estate market analysis, you want to go for a place with a high demand for vacation rentals. You also want to select a property that will stay booked for most of the year. It is what we call Airbnb demand.
The best metric to evaluate Airbnb demand is Airbnb occupancy rate. It is the ratio of booked nights over the total number of nights the short term rental is available for booking. In short, it’s the percentage of nights your vacation rental is booked by guests.
Why is Airbnb demand information important? As an investor, you want your investment to generate the highest return possible. When it comes to Airbnb, low demand means that your property will stay vacant for most of the year. You miss out on potential earnings each night your rental stays unoccupied.
How Can I Determine the Airbnb Demand in My Area?
There are several ways to determine the demand for short term rentals in a certain area. In some cases, investors can do manual research to check the booking history of Airbnb rentals in a particular market. However, the process can take too much time and effort, not to mention that it also be prone to error, resulting in inaccurate projections.
Fortunately, with the advancement of modern technology, performing real estate research doesn’t need to be done manually. Most investors these days use real estate platforms to help them determine whether a market is optimal for real estate investing or not by studying historical data, including bookings and seasonality.
One of the best ways to answer the question, “Is there sufficient Airbnb demand in my area?” is to use Mashvisor’s real estate tools. Mashvisor can help you access the essential Airbnb data by city, neighborhood, and even for each investment property.
Getting the Airbnb Demand by City
Mashvisor’s Heatmap tool gives you an overview of which areas in a city have the highest and lowest Airbnb occupancy rates.
To determine whether there is a strong demand for short term rentals in a particular city, you should consider factors such as leisure travel and business activities.
Keep in mind that short term rental properties do not only attract leisure travelers, but business travelers as well. Hence, a short term rental market that’s near business districts is as lucrative as one that’s near tourist attractions.
To find the Airbnb demand in a particular area or the entire city, you can use Mashvisor’s tools to help make your search process more convenient. The best thing about Mashvisor is that it allows you to search any location in the US. It makes property search a practical option if you’re also interested to know the demand for short term rentals in other cities apart from your own.
So, what is the tool offered by Mashvisor that will help you find the Airbnb demand in your city of choice? The tool is known as Property Finder.
What Is Property Finder and How Does It Work?
What makes the Property Finder tool special is that investors can easily search for Airbnb for sale by simply typing in the city of their choice. We take the Airbnb dataset from the Airbnb website itself and other short term rental platforms on a regular basis. It means that you don’t have to worry about data accuracy and relevance.
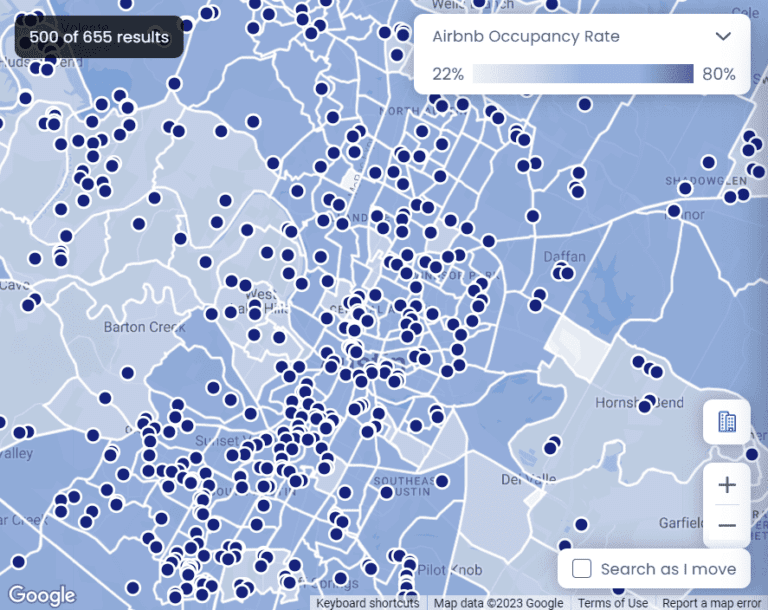
To use the Property Finder tool to find the answer to your question: “What is the Airbnb demand in my area?”, you simply need to type your city’s name in the search box. You can also search any area you’re interested in investing in. Then, activate the Airbnb demand map by using the heatmap tool and selecting the filter “Airbnb Occupancy Rate.”
It allows you to see which areas within the city experience low demand and which ones see high demand with more than 50% occupancy rates. To make things a lot easier, you can turn on the full-color option for the heatmap so that you can easily see which areas show the highest short term rental occupancy rate.
Areas in green are those with occupancy rates, while those in darker orange or red see the lowest Airbnb demand. Areas in yellow and lighter orange mean the demand for short term rentals is neutral, neither high nor low.
Determining Airbnb Demand at the Neighborhood Level
The next step in the process of identifying the Airbnb demand in your city or any area of choice is to carry out a neighborhood analysis. As a smart real estate investor, you realize that getting access to Airbnb demand data for cities isn’t enough to make prudent business decisions. Conducting a thorough rental analysis is needed to ensure that you’re making the right decision.
Even though the short term rental market is expected to remain strong this year despite fears of a slight US housing market crash, you still need to be extra careful. You need to perform proper real estate research. It will help guarantee that the property you are investing in will give you the solid returns you need to succeed.
To do it, you need to gain a deeper insight—not only into the city’s income potential—but also into the neighborhood level as well. Remember, even if the city makes for a good investment, not every neighborhood within the same city will be ideal for building your Airbnb business.
Ways to Identify the Airbnb Demand In a Certain Neighborhood
There are two ways to determine Airbnb demand at a neighborhood level:
1. Manual
The traditional way to know Airbnb demand in any neighborhood is by going to the area in question, identifying a few Airbnb hosts, manually collecting data, and then analyzing it. However, the process is tedious from the very beginning, not to mention that it is also prone to error, leading to inaccurate analysis.
2. Using Real Estate Tools
With Mashvisor, you can gain access to tools that help you collect all the Airbnb analytics you need in just about 15 minutes. The tools include the Property Finder and Market Finder, which allow you to analyze the Airbnb demand in a neighborhood.
Property Finder and Heatmap
Simply type the name of the neighborhood that you want to assess in the search box and look for it on the heatmap.
Make sure to turn the “Neighborhoods” toggle (shown as a building icon above the plus and minus signs on the lower right portion of the map) on. It lets you see the surrounding neighborhoods on the map, shown as yellow dots.
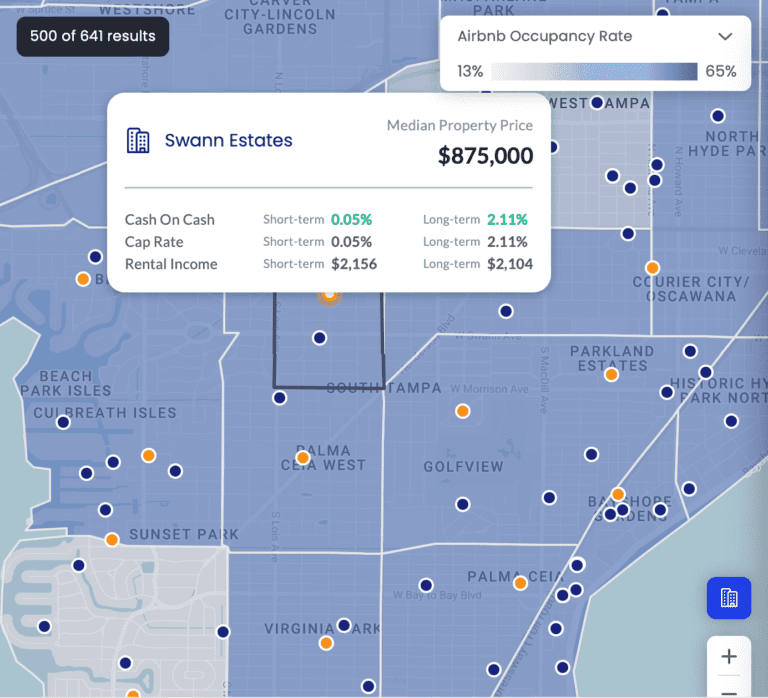
Mashvisor’s heatmap search with the Neighborhoods toggle on shows all surrounding neighborhoods in yellow dots.
You can click the neighborhood that you’re searching for, and it will lead you to the neighborhood analytics page, where you will find the following essential metrics:
- Median property prices
- Price per square foot
- Cash on cash return for both long term and short term rentals
- Monthly rental income for both Airbnb and long term rental strategies
- Active Airbnb properties and number of long term rental listings
- Airbnb occupancy rate
- Most suitable rental strategy (long term vs. short term rental strategy)
- Other information, such as Walk Score, Bike Score, and Transit Score
- Mashmeter, a score that evaluates the investment opportunity of a particular market
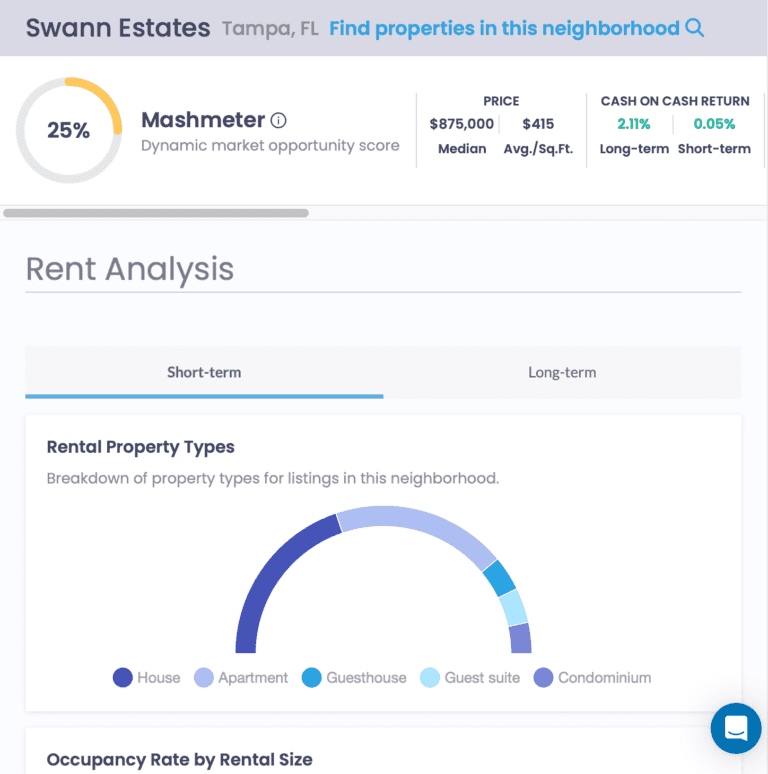
Mashvisor’s neighborhood analysis page shows various metrics that can help you decide whether the neighborhood has sufficient demand for short term rentals.
Other Information You Can Find on the Neighborhood Analysis Page
Other than the mentioned information, you will also see analyses of occupancy rates by rental size and rental size distribution, as well as occupancy rate state and rental income stats.
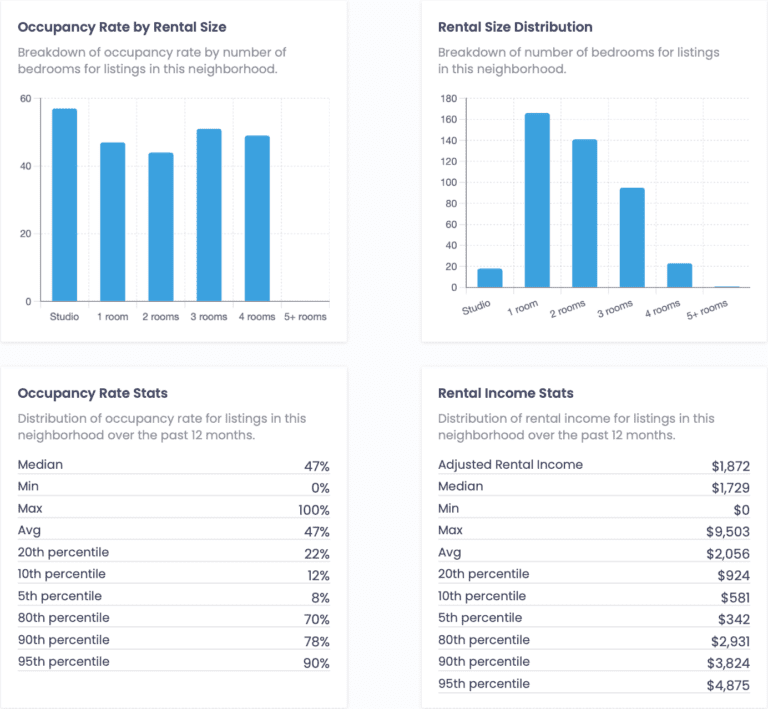
Mashvisor users can also find useful stats on Airbnb demand and rental income in the neighborhood analysis page.
The benefit of the above tool is that you can also access the rental comps, as well as the historical rental income of active vacation rentals in that area. You can also find links to their Airbnb listings on the platform. It helps you further understand what makes the specific neighborhood perfect for the Airbnb business.
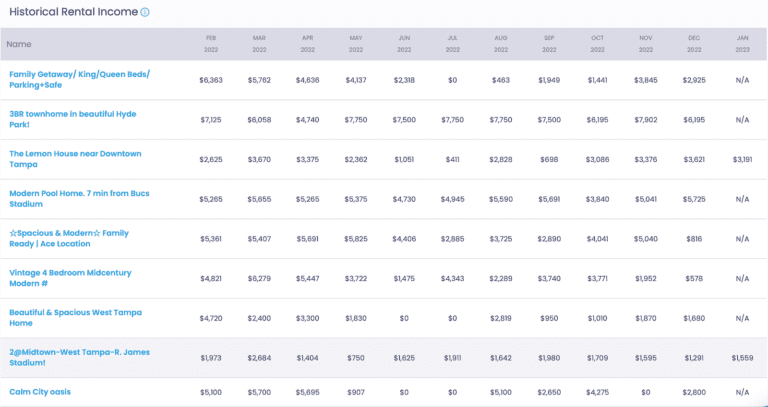
Mashvisor also shows the historical income of active and verified Airbnb listings for accurate rental comps analysis.
What’s more, you’ll also see charts of both historical average rental rates and historical average occupancy rates for the past 12 months.
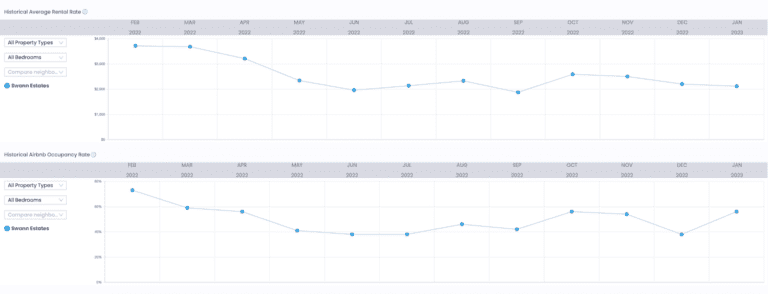
Mashvisor users can find the historical average rental and occupancy rates of a neighborhood on the neighborhood analysis page.
Market Finder and Heatmap
Market Finder is helpful when it comes to getting an overview of the US housing market. With the Market Finder tool, you can zoom in on certain areas. It lets you achieve an in-depth understanding of how the specific market performs when it comes to investing in short term rentals.
The tool provides a more detailed analysis of a neighborhood, helping you understand its income potential, as well as its current and projected Airbnb demand. With Mashvisor’s Market Finder, it would be easy for you to answer your question: “Is there enough Airbnb demand in my area?”
Similar to Property Finder, the Market Finder tool also uses a heatmap to show the different metrics in the neighborhood of your choice. If you’re trying to find the best neighborhoods for a short term rental investment, you can make use of different filters to optimize your search results.
Optimize Your Market Finder Search Using Filters
Here are the filters that you can use when searching through Market Finder and what they do:
- Mashmeter: The Mashmeter score shows the evaluation of a location, with A as the highest or most optimal for investing and D as the lowest or least desirable.
- Occupancy Rate: This filter shows you which neighborhoods have the highest occupancy rate of your choice. You can set a minimum figure.
- Monthly Rental Revenue: Use this filter to generate results that match your ideal monthly rental revenue.
- Home Value: This filter allows you to find homes for sale that meet the budget within your price range.
- Cap Rate: This allows you to select the cap rate range that you desire. You cannot select below 2% because the ideal cap rate is at least 2% or higher.
Other filters that you can set are the property type, crime and safety, and school rankings. You can also set the regulatory filter to know which markets have the most lenient regulations when it comes to operating a short term rental business.
Start analyzing cities or neighborhoods of your choice. Sign-up with Mashvisor now to see how its tools work.
Determining Airbnb Demand for Each Property
Once you’ve found data for Airbnb demand in your chosen area, it’s time to find specific properties that are prospects for Airbnb rental strategy. Remember, just because properties are in a high-performing neighborhood doesn’t mean that they can make good Airbnb rentals.
Also, some properties may be great for a long term rental strategy but are not suitable as vacation rentals. Your chances of getting constant bookings and earning a consistent income depend on the property type, amenities, and other various factors.
Mashvisor helps you determine which strategy is best. Each property listing page features an Airbnb calculator. Aside from the selling price and home features, you can also access the following data:
Airbnb Rental Income
As a savvy real estate investor, you know that you can’t succeed in the Airbnb business if you just set any nightly rate you feel like. You need an optimized Airbnb pricing strategy that takes into account the local Airbnb listings, occupancy rates, and expenses. Since Airbnb is seasonal, using a dynamic pricing strategy is crucial.
The Mashvisor investment property calculator gives you access to Airbnb comps for your rental property. You can then estimate how much rental income you can expect to make based on other comparable rental properties within the same neighborhood.
Airbnb Expenses
When it comes to property costs and expenses, owning an Airbnb rental is pretty much like owning a long term rental, and you’ll need to pay for costs such as:
- Property insurance
- Property taxes
- Property management fees
- Maintenance
Before settling on a nightly rate, you ought to consider the above expenses. Mashvisor’s Airbnb calculator shows you estimated expenses for every listing on the platform. The best thing is that you can adjust the expenses based on your research and your personal plans for more accurate results.
Airbnb Cash Flow
Cash flow is king in any business. It is typically the rental income or profits after expenses. Primarily, you want to invest in a property that generates positive cash flow, where the rental income outweighs the expenses.
Our Airbnb profit calculator factors in all Airbnb data and automatically calculates the cash flow for you. When you click on any listing that interests you, you can immediately tell whether it comes with the potential to make positive cash flow or not.
Airbnb Occupancy Rate
This is the most crucial metric that answers your question: “What is the Airbnb demand in my area?” It’s arguably the main pillar of your short-term rental business. A property with a high occupancy rate means that it has a high Airbnb demand.
For every property listed on the Mashvisor platform, you’ll find Airbnb occupancy rate by city. Mashvisor pulls Airbnb listings, calendar bookings, reviews, and other crucial data from Airbnb for the past five years. The historical data is then used to calculate the occupancy rate by counting its bookings over the past 12 months, day by day and month per month.
Airbnb Rental Comps
Airbnb rental comps data is crucial when conducting analysis as it helps you determine property value and set the right nightly rate. Gathering and analyzing Airbnb comps manually can be an uphill task. Besides, organizing the comps data on spreadsheets is not only hard but can also lead to many errors in your investment analysis.
Mashvisor saves you all the trouble. We provide readily available Airbnb comps data for any listing on the platform.
Our AI algorithms fill out the data based on comparable Airbnb properties in that area or costs with standard pricing. If you feel a certain amount should be higher or lower, you can edit the number and even add other custom expenses for a more accurate projection.
Once you’re done with the calculations, you can scroll down to the bottom of the page, where you’ll find the Investment Payback Table. It will show you how much profit Airbnb rental can generate for you in the next 10 years. The data shown in the table will be based on the numbers you entered in the calculator.
With the provided information, you can then decide whether to proceed and make an offer on the property or look for a more suitable one.
What Affects Airbnb Demand?
Airbnb demand in a certain area differs from that of other locations. While the location may be a vital factor when checking for Airbnb demand, it’s not the only one that you should consider. Other important factors that you need to take into account include:
Competitor Prices
If you’re doing everything to boost your occupancy rate, but your Airbnb demand isn’t improving, there could be one important aspect you’re missing. You might not be looking at your competitors. Studying the competitor prices can help you answer the question: “How can I improve Airbnb demand in my area?”
How Can You Use Competitor Prices to Your Advantage?
Studying the rental comps can help you determine the best rental estimate for your Airbnb, too. Here’s how you can perform rental comps and use competitor prices to your advantage:
- Find at least five rentals of the same property type and with the same number of rooms and amenities.
- Investigate the calendar bookings for each rental.
- Calculate the price and determine the occupancy rate for each month.
If your competitors are experiencing near 100% booking rates, they might be leaving some money on the table. Full bookings for the next two or three months can mean that their nightly rates are too low. Conversely, an occupancy rate of 75% may mean that they’ve set their nightly rates too high.
Use Mashvisor’s Dynamic Pricing Tool
Using a dynamic pricing strategy can help you set the best rate based on the season. During the peak season, you can set a higher nightly rate since Airbnb demand is high. On the other hand, you can switch to a lower nightly rate when the market is more dormant.
Mashvisor’s Dynamic Pricing tool makes the process a lot easier. The Mashvisor automated pricing feature offers pricing recommendations based on factors like booking history, local events, current market demand, seasonality, and trends. With the tool, you don’t need to do manual rental comps, making the process a lot easier and more efficient.
Mashvisor’s Dynamic Pricing tool does not only provide pricing recommendations based on the current season—it also offers other features that help you make informed decisions. With the Dynamic Pricing feature, you can access the following:
- Market Insights: The tool provides you with a better picture of the market’s condition. It lets you check how comparable Airbnbs perform in your area so you can strategize your investment properly.
- Smart Pricing Calendar: The tool sets prices on your calendar based on AI-powered recommendations. You can easily sync your prices from the Mashvisor platform directly to your Airbnb calendar.
- Customized Configuration: What’s best about the tool is that you can configure your base, minimum, and maximum prices, giving you full control of your earnings. You can also block off certain periods in the calendar.
Amenities
One of the reasons why travelers often prefer Airbnb since the rise of home-sharing platforms more than a decade ago is because of its unique amenities. Most short term rentals offer amenities that provide occupants with a homey experience. Unlike staying at hotels, Airbnb makes guests feel more at home.
Here are some of the top amenities that most guests are looking for in a short term rental:
- Pools
- Pet-friendly rentals
- Free parking
- Coffee machine
- Full-functioning kitchen
- High-speed WiFi
- Complimentary drinking water
- Bicycle
Do you want to see how Mashvisor can help you become a successful Airbnb owner? Schedule a demo now to see how our unique features work.
Bottom Line
Investing in high-profit opportunities is crucial if you want to succeed in real estate. When investing in short term rentals, you must ensure that there is sufficient market demand in your chosen location before you buy vacation rentals for sale. With the tips mentioned above, you won’t need to ask yourself the question: “How do I find Airbnb demand in my area?” anymore.
A rental with low demand means that you’ll likely experience lengthy vacancies, leading to potential losses. In contrast, a short term rental with high demand from guests is likely to get a high occupancy rate. It means you can choose to charge higher night rates to maximize your earning potential.
If you’re looking for Airbnb demand in your chosen area, use Mashvisor’s tools to help make your research and analysis more efficient and effective. The platform provides a variety of features that provide in-depth short term rental analysis.
With Mashvisor, you don’t need to worry about data accuracy since we use AI and machine-learning algorithms, and our data is pulled directly from the Airbnb platform itself. In addition, we regularly update our database to provide you with the freshest and most relevant information so you can make the right decision.
To find out the Airbnb demand in your area and other key Airbnb metrics, sign up for Mashvisor today.


 English (US) ·