In today’s competitive rental market, a real estate heatmap is your first step towards identifying the areas with properties that promise solid returns while minimizing risk.
Assessing rental income and risks upfront empowers investors to make data-driven decisions, avoid costly surprises, and maximize long-term profitability through effective rental property analysis. With the right rental insights, you can confidently identify high-yield neighborhoods, uncover opportunities, and build a resilient portfolio.
That’s where Mashvisor’s real estate heatmap and investment property calculator come into play.
The real estate heatmap provides an intuitive, color-coded overview of neighborhood performance, allowing you to instantly identify areas with high rental income potential and low vacancy risks.
Once you’ve zeroed in on a promising location, the investment property calculator steps in to deliver a granular ROI calculator real estate investors trust. It automatically factors in purchase price, expenses, financing, and projected rental income to forecast cash flow, cap rate, and cash-on-cash return.
By combining the speed of a visual neighborhood analysis tool with the precision of a powerful calculator, you’ll streamline your due diligence process and make smarter investment decisions.
In this post, we’ll show you exactly how to use these Mashvisor investment tools to evaluate properties from the broad market down to the individual address, so you can invest with confidence and grow your rental income potential.
Step 1: Assess Rental Income and Risks
Before evaluating individual properties, start by understanding the overall revenue potential and pitfalls in your chosen market. A thorough income-and-risk assessment gives you confidence that the numbers add up before you commit capital.
Understand Market Trends and Income Potential
To forecast rental earnings accurately, consider these three core indicators:
- Occupancy rate: The percentage of days a property is expected to be rented. Look for markets where occupancy consistently exceeds 70% for long-term rentals and 50% for short-term rentals. These suggest reliable demand and fewer dark days without tenants.
- Nightly rate or median rental revenue: If you’re investing in short-term rentals, analyze the average price charged per night across comparable listings. This figure directly impacts revenue projections and helps you position your property competitively in the market. Investing in a long-term rental? Look into median rental revenue.
- Demand fluctuations: Evaluate seasonality, local events, and long-term trends to identify patterns. Markets driven by tourism may spike during peak seasons but languish off-season. Balanced markets with year-round demand reduce income volatility.
Identify Key Risk Factors
Every rental market carries hazards that can erode profits. Anticipate and plan for these risks:
- Low occupancy zones: Areas with occupancy rates lower than 50% may signal oversupply or waning interest. Such markets demand extra caution and deeper competitive analysis.
- Seasonal downturns: If a locale relies on a short tourist season, build cash reserves for slow months. Factor these lean periods into your projections to better predict potential cash flow across the year.
- Market saturation: The constant addition of new listings can drive rates downward. Track inventory growth and review how many similar properties compete for the same guests or tenants.
- Regulatory shifts: Changes in rental laws, zoning, or taxation can instantly alter profitability. Stay informed on local regulations and include contingency buffers.
- Economic downturns: Broad economic recessions or local job market declines can reduce travel and rental demand. Stress-test your projections by modeling lower occupancy and rate scenarios during economic slumps.
Combining realistic income estimates with a careful review of potential risks helps you create more accurate projections for your cash flow and lay the groundwork for confident investment decisions, as outlined in the next step.
Step 2: Use the Real Estate Heatmap for Neighborhood Insights
Now that you’ve gauged overall income potential and identified key risks, it’s time to see which neighborhoods deserve your attention. The real estate heatmap bridges your market-level assessment from the first step to actionable location insights, helping you spot areas where your projected rental returns and risk tolerance align.
What Is a Real Estate Heatmap and Why Does It Matter?
A real estate heatmap is a color-coded, interactive map that visualizes key market metrics, such as occupancy rates, rental income, and market saturation, across neighborhoods. By translating complex data into intuitive visuals, heatmaps empower you to quickly identify where to focus your property investment analysis.
- Speed and clarity: Rather than sifting through spreadsheets, the heatmap shows performance tiers at a glance. Hot zones indicate high income potential or strong occupancy, while lighter tones reveal areas that may underperform.
- Comparative analysis: You can compare multiple neighborhoods side by side, spotting relative strengths and weaknesses. This comparative edge is crucial for deciding between similar markets or rental strategies.
- Risk mitigation: Visualizing vacancy and saturation helps you sidestep overheated markets. By seeing clusters of low-performance areas, you avoid zones where competition may erode your returns.
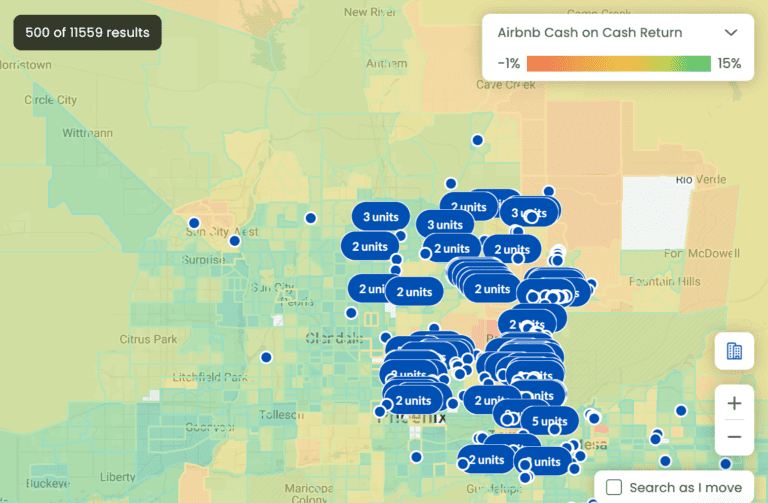
Mashvisor’s real estate heatmap showing which parts of Phoenix, AZ have the highest and lowest Airbnb cash-on-cash return
How to Use Mashvisor’s Heatmap to Evaluate Neighborhoods
Mashvisor’s real estate heatmap integrates seamlessly into your workflow, offering customizable filters and real-time data overlays. Here’s how to use it for insightful property investment analysis:
1. Set Heatmap Filter
When you turn on Mashvisor’s heatmap, you’ll need to select one of the following filters:
- Mashmeter score: Our proprietary rating that summarizes neighborhood performance across rental income, occupancy, and listing metrics, giving you a quick snapshot of overall market health.
- LTR/STR cash-on-cash return: See which neighborhoods have the highest or lowest cash-on-cash returns, whether you’re targeting long-term rental yields or short-term rental yields.
- LTR/STR rental income: Find out the income range in the city of your choice. You can toggle between median monthly rental income for long-term and short-term strategies.
- Listing price: Glimpse which neighborhoods have the highest or lowest sale prices to discover which areas align with your financial capacity.
- Airbnb occupancy rate: Highlight areas with strong short-term rental occupancy to minimize dark days and stabilize your cash flow.
2. Read Heatmap Visuals for Performance Metrics
Once you’ve set the filter for the heatmap, you’ll then see the map change colors.
- Color gradients: Understand what each hue represents based on your set filter. By default, Mashvisor’s heatmap is in different shades of blue, with the darkest shade showing the hotspots and the lightest shade showing the low-performance areas. When you turn on the full color, the hotspots will be in shades of green while the low-performance spots will be in shades of red.
- Data pop-ups: From there, you may click on specific circles to preview a property in that area and see its features, listing price, cash-on-cash return, cap rate, and rental income projections. This helps you find an investment home in a “hot” zone.
3. Spot High-Potential Locations at a Glance
Once you understand what the colors in the heatmap represent, you can find a property from there. But there are other ways to analyze the heatmap:
- Cluster identification: Look for contiguous green (or dark blue) clusters. These signify neighborhoods with multiple strong-performing properties, indicating stable demand and community-level appeal.
- Edge opportunities: But don’t ignore transitional zones, where colors shift from yellow to green (or medium to dark blue). These border areas often offer growth potential before they become mainstream hotspots.
By mastering Mashvisor’s heatmap, you can screen the market faster and optimize your property investment analysis, ensuring that you’re always one step ahead.
Sign up now to scan your target cities using Mashvisor’s real estate heatmap and spot high-yield neighborhoods in seconds.
Step 3: Run ROI and Cash Flow Analysis With the Investment Property Calculator
Once you’ve identified promising neighborhoods with the real estate heatmap, it’s time to dig into the numbers at the property level. A deeper ROI and cash flow analysis ensures that your top-line income projections align with real-world costs.
Why Deeper Analysis Is Needed After Narrowing Down Properties
Identifying high-potential areas is just the first step. Neighborhood-level insights reveal where to look, but individual properties can vary dramatically based on purchase price, financing terms, and operating expenses. Running a granular analysis with a rental income calculator prevents costly assumptions and uncovers whether a specific address will truly meet your return targets.
- Avoid overpaying: Market heat zones may command premium prices. Without detailed cost inputs, you risk buying at a valuation that erodes your profit margins.
- Validate income estimates: Heatmap projections are averages. Your property’s unique features and condition can impact actual revenue. Calculator-driven forecasts for a specific property adjust for these assumptions.
- Stress-test scenarios: Simulate different occupancy and expense scenarios to ensure resilient cash flow under varying market conditions.
How Mashvisor’s Investment Property Calculator Works
Mashvisor’s investment property calculator simplifies complex financial modeling into an easy-to-use interface. It combines inputs with real-time market data for accurate projections.
Inserting Data: Property Price, Financing, Expenses, and Rates
- Property price: By default, the calculator has already input the listing price of the property, but you may change it to the amount you plan to offer.
- Financing details: If you’re not paying with cash, toggle on the mortgage calculator. Select your mortgage type (Fixed Rate, Interest Only, or Adjustable), input down payment amount or percentage, loan term, interest rate, and closing costs. This calculates your loan amount and mortgage payments, then determines how they impact your cash-on-cash return.
- Operating expenses: Include one-time expenses such as inspections, repairs, and furnishing. Then factor in recurring costs, such as insurance, utilities, property management, maintenance, HOA dues, and taxes. Mashvisor’s calculator has space for these, but you may also add your own custom expenses for a more accurate estimate.
- Occupancy rate (STR or LTR): By default, the calculator has estimated the percentage of days (short-term) or months (long-term) the property will be rented based on market averages, but you can adjust these values.
- Nightly rate (STR): The calculator has also input the expected average price per night for vacation or short-term rentals, but you can also change this.
- Monthly rate (LTR): This is the projected monthly rent for long-term leases. The calculator has already provided the market average by default, but you may adjust this number.

Analyzing Cash Flow: Monthly Income vs. Costs
- Income projections: The rental income calculator then estimates monthly and nightly revenue based on your inputs.
- Expense deductions: The calculator subtracts all operating costs from gross income, revealing net monthly cash flow. Positive cash flow properties generate income from day one, while negative cash flow warns you to renegotiate, recalculate, or walk away.
Calculating ROI: Cap Rate and Cash-on-Cash Return
- Cap rate: This is the ratio of the property’s net operating income to its purchase price. It represents the ROI without accounting for financing. You can compare the calculator’s result against market averages to gauge the property’s relative value.
- Cash-on-cash return: This metric incorporates financing to show the return on actual cash invested. It’s vital for investors using leverage, as it reflects the real-world yield on your down payment.
By combining neighborhood-level insights from the real estate heatmap with property-level forecasts in the investment property calculator, you’ll make data-driven decisions that balance ambition with prudence, maximizing returns while minimizing surprises.
Real-World Example: From Heatmap to Investment Analysis
To see how Mashvisor’s platform works in practice, let’s walk through a real-world scenario using both the real estate heatmap and investment property calculator. This example shows how you can use these real estate investment tools to find and evaluate profitable opportunities.
Step 1: Use the Real Estate Heatmap to Shortlist Opportunities
Let’s say you’re an investor looking to purchase a short-term rental in Phoenix, Arizona. Instead of jumping into random listings on the Map Property Finder, you begin by switching on the real estate heatmap, displaying the full color, and setting the filter to Airbnb cash-on-cash return to get a visual market overview.
Instantly, several neighborhoods light up in green, signaling high potential. Because there are too many blue dots (properties for sale) on the map, you set a filter to show only properties with an STR cash-on-cash return of at least 10%.
You scroll through the list of properties for sale, hover over them to see where they are on the map, and click on their neighborhood name to see Mashvisor’s analysis of this area. This leads you to discover Sunnycrest has a 52% median Airbnb occupancy rate. While the median Airbnb cash-on-cash return is only 6.59%, you decided to zoom in on that neighborhood.
Hovering over each dot gives you quick stats on the property’s projected ROI and income based on the local market average. This scan narrows down your options to three properties with at least 5% Airbnb cash-on-cash returns for further review.
Step 2: Evaluate Properties Using the Investment Property Calculator
You then select a property in Sunnycrest priced at $215,000. With the calculator, you review and adjust the relevant numbers:
- Property price and estimated closing costs
- 20% down payment, 30-year fixed mortgage at 6.76% interest
- One-time expenses like inspections, repairs, and furnishing
- Monthly expenses like insurance, utilities, and property management
- Expected nightly rate of $213 with a 56% occupancy rate
The calculator delivers a full breakdown:
- Monthly rental income: $2,869
- Monthly expenses: $2,299
- Cash flow: $570 per month
- Cap rate: 10.36%
- Cash-on-cash return: 17.18%
With this data, you can confirm that the property is not just located in a high-performing neighborhood, but it also meets your personal return goals. What began as a broad scan using the real estate heatmap ends with a confident, data-backed investment decision powered by Mashvisor’s all-in-one real estate investment tools.
This seamless workflow—from macro-level market insight to micro-level financial evaluation—illustrates how investors can eliminate the guesswork of property selection and make smarter, faster moves in today’s competitive market.
Join Mashvisor to start analyzing any listing on the market with the investment property calculator and see its full ROI potential.
3 Tips for Smart Investment Decisions
No matter how promising a property looks on paper, your success as a real estate investor depends on the decisions you make before you buy. The best investors aren’t just data-driven; they’re also disciplined and realistic in interpreting that data.
Here are three tips to help you make smarter, more profitable investment decisions:
1. Combine Neighborhood and Property-Level Analysis
A high-performing property in the wrong neighborhood (or vice versa) can quickly fall short of your expectations. That’s why it’s essential to pair macro and micro views.
Start by evaluating broad market trends with a tool like the real estate heatmap. Then, find areas with strong rental demand, stable occupancy, and consistent income potential.
Then, use detailed ROI and cash flow projections to zero in on specific properties. Only when both levels align should you move forward.
2. Regularly Update Assumptions and Market Inputs
The numbers you analyze today may not hold six months from now. Interest rates, property taxes, nightly rates, and vacancy trends can all shift with the market.
To protect your investment, revisit your assumptions regularly and update the inputs in your investment property calculator to reflect the latest local data. Even minor adjustments can reveal whether an investment is still viable or starting to drift off course.
3. Avoid Overestimating Income or Underestimating Costs
Optimism is not appropriate for your pro forma. Estimate rental income conservatively and calculate expenses cautiously.
Pad your cost projections with buffers for repairs, vacancies, and unexpected fees. If the numbers still work under these stricter conditions, you’ve likely found a solid opportunity. Otherwise, keep searching. There’s always another deal worth analyzing.
Following these tips helps ensure you don’t just invest, but invest wisely with the full picture and a margin for error in every decision.
Conclusion
Evaluating a potential investment property doesn’t need to be a shot in the dark. By combining the big-picture insights of the real estate heatmap with the precise projections of the investment property calculator, you can confidently navigate every stage of your analysis.
Start by assessing income potential and market risks to ensure the viability of your target location. Use the real estate heatmap to visualize key metrics and shortlist the best-performing properties.
Then, shift from neighborhood-level insight to property-level accuracy using the investment property calculator. With this tool, you can factor in property prices, financing details, expenses, and expected revenue to forecast cash flow, cap rate, and cash-on-cash return.
Whether investing in short-term rentals or long-term leases, this two-step approach ensures you make confident, data-backed decisions instead of guesses. It’s a repeatable, scalable process that helps you minimize risk and maximize returns.
Ready to put this into practice? Sign up today and take advantage of all of Mashvisor’s real estate investment tools.


 English (US) ·