

Geelong’s cheapest suburbs have shown the best median home price growth in the first three months of 2026.
Affordable Geelong suburbs have emerged as the biggest winners this year as the cost of the living crunch hits househunter budgets.
Home values in some entry-level hotspots have surged more than $20,000 over the past three months, according to PropTrack’s quarterly median figures.
Whittington, Norlane, Bell Park and St Albans Park – all with a sub-$700,000 medians – were the city’s top performers, recording 4 per cent growth to the end of March.
RELATED: Work from home call a boost for Geelong market
Rate hike to heap price pressure on Geelong homebuyers
Mortgage stress forces Aussies to skip medical care
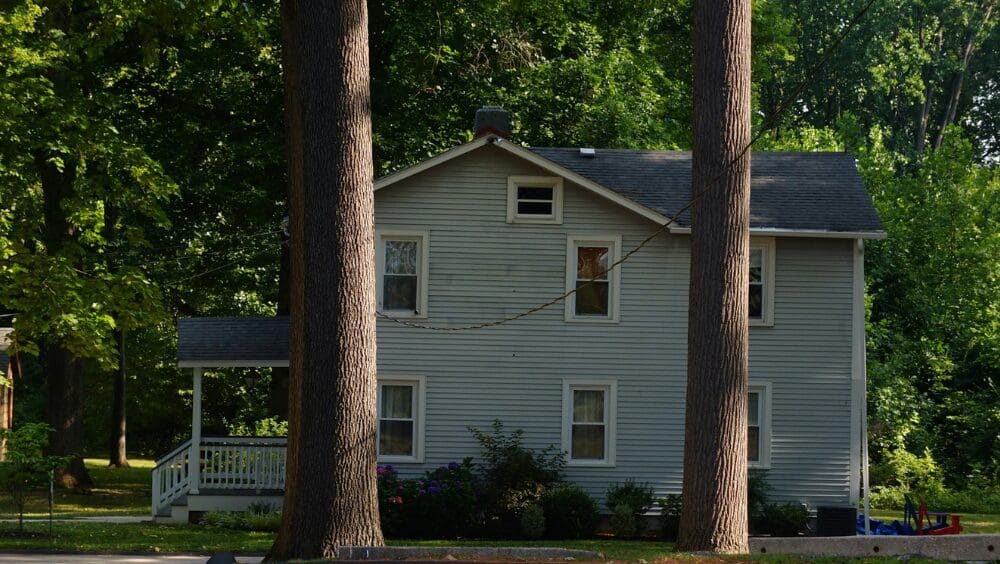
This three-bedroom house at 253 Boundary Rd, Whittington, sold for $616,000 in March.
The strongest change was in Whittington where the median house price climbed $23,000 to $585,000.
This represents an 18 per cent year-on-year increase, driven by a surge in interstate investor and first-home buyer activity.
While most suburbs across the region held steady, the data shows values eased slightly in several premium markets, including Newtown, Wandana Heights and Fyansford.
Harcourts, North Geelong agent Joe Grgic said affordability was a key driver across Geelong, with recent rate rises not yet appearing to soften buyers’ appetite.
However, he said a shift towards even cheaper properties was emerging as borrowing capacities were stifled.
This three-bedroom house at 103 Solar Drive, Whittington, will set you back $670,000-$710,000.
This new two-bedroom townhouse at 5B Hammersley Rd, Bell Park, is on the market for $649,000 to $709,000.
Geelong houses: what your home is worth
| Suburb | Median house value | 3 month growth | 12 month growth |
| Anglesea | $1,484,622 | 3% | -3% |
| Armstrong Creek | $696,202 | 1% | 8% |
| Bannockburn | $776,216 | -1% | 4% |
| Barwon Heads | $1,481,819 | -1% | -2% |
| Bell Park | $691,491 | 4% | 14% |
| Bell Post Hill | $718,724 | 3% | 15% |
| Belmont | $758,019 | 3% | 12% |
| Breakwater | $585,616 | 2% | 14% |
| Charlemont | $670,005 | 1% | 9% |
| Clifton Springs | $702,115 | 0% | 6% |
| Corio | $579,126 | 3% | 22% |
| Curlewis | $702,332 | 2% | 8% |
| Drysdale | $765,645 | 1% | 8% |
| East Geelong | $826,831 | 0% | 9% |
| Fyansford | $959,571 | -1% | 1% |
| Geelong | $892,512 | -2% | 3% |
| Geelong West | $853,869 | 1% | 5% |
| Grovedale | $728,243 | 1% | 11% |
| Hamlyn Heights | $762,708 | 0% | 9% |
| Herne Hill | $758,921 | 2% | 12% |
| Highton | $893,461 | 0% | 5% |
| Indented Head | $794,579 | -2% | 0% |
| Jan Juc | $1,450,306 | 0% | 6% |
| Lara | $734,125 | 1% | 9% |
| Leopold | $718,387 | 1% | 8% |
| Lorne | $1,787,904 | 1% | -6% |
| Lovely Banks | $813,734 | 0% | 13% |
| Manifold Heights | $969,522 | 0% | 3% |
| Marshall | $684,441 | 2% | 11% |
| Mount Duneed | $739,456 | 0% | 8% |
| Newcomb | $627,772 | 3% | 15% |
| Newtown | $1,167,192 | -1% | 1% |
| Norlane | $535,349 | 4% | 21% |
| North Geelong | $682,704 | 1% | 14% |
| Ocean Grove | $978,514 | 1% | 3% |
| Point Lonsdale | $1,257,208 | -2% | -1% |
| Portarlington | $861,960 | 0% | 2% |
| Queenscliff | $1,407,794 | -5% | -1% |
| St Albans Park | $665,970 | 4% | 15% |
| St Leonards | $737,229 | -1% | 3% |
| Thomson | $592,044 | 2% | 15% |
| Torquay | $1,246,331 | 0% | 2% |
| Wandana Heights | $1,028,084 | -1% | 4% |
| Waurn Ponds | $837,061 | 0% | 8% |
| Whittington | $585,737 | 4% | 18% |
| Winchelsea | $653,863 | 0% | 4% |
Source: PropTrack
“I have actually had first-home buyers saying ‘I am now looking at this price point because of what’s happened’,” Mr Grgic said.
“What we found earlier in the year and at the end of last year was that it was all about houses on 500sq m blocks, sub $750,000, even up to $800,000.
“However, we are now finding two-bedroom units in that $500,000 mark are actually quite busy so people are looking laterally if they want to be in that same suburb or they may even look in suburb that’s a little bit more affordable.”
Mr Grgic said while the current climate made it more challenging for first-home buyers without equity to tap into, those he encountered had disciplined saving strategies to put themselves in a strong position.
REA senior economist Anne Flaherty tips affordable areas to have the strongest price growth going forward.
REA Group senior economist Anne Flaherty said it was difficult to predict how greater economic uncertainty would impact the market going forward.
But she said if people were more hesitant to sell, it could affect the supply of properties and potentially push up prices.
“I think what we will see is a difference of performance between more affordable regions and higher priced areas,” she said.
“And we’re already seeing that now, are where we are seeing some of the more expensive suburbs record declines and those more affordable areas record greater levels of price growth.
“And I think that the 5 per cent home deposit scheme is also factoring into that.”
This one-bedroom unit at 6/436 Ryrie St, East Geelong, sold for $395,000.
Palm Springs influence runs through this three-bedroom townhouse at 112A Powell St, Ocean Grove, on the market for $1.5m to $1.65m.
The PropTrack data shows Ocean Grove recorded the strongest unit growth for the quarter, with the median value jumping more than $58,000.
Units also proved a popular entry point to East Geelong, where the typical price climbed $16,000 to $5542,000.
Geelong units: What your home is worth
| suburb | Median unit value | 3 month growth | 12 month growth |
| Bell Park | $553,433 | 2% | 13% |
| Belmont | $558,637 | 1% | 9% |
| Corio | $426,972 | 1% | 14% |
| Drysdale | $563,133 | 1% | 4% |
| East Geelong | $542,614 | 3% | 11% |
| Geelong | $594,313 | 0% | 3% |
| Geelong West | $555,101 | -2% | 6% |
| Grovedale | $535,583 | 2% | 8% |
| Hamlyn Heights | $581,202 | 0% | 11% |
| Herne Hill | $381,986 | -3% | 4% |
| Highton | $556,378 | 0% | 8% |
| Lara | $510,243 | 0% | 13% |
| Leopold | $520,806 | 1% | 4% |
| Lorne | $1,146,286 | -1% | -3% |
| Manifold Heights | $511,538 | 1% | 11% |
| Newcomb | $500,138 | 3% | 8% |
| Newtown | $610,562 | -2% | 8% |
| Norlane | $440,694 | 1% | 13% |
| Ocean Grove | $773,722 | 8% | -1% |
| Portarlington | $662,216 | -1% | 3% |
| St Leonards | $583,445 | -2% | -2% |
| Torquay | $870,478 | 1% | 2% |
| Whittington | $430,703 | 2% | 9% |
Source: PropTrack
Help us improve your reading experience
Got a minute? Your feedback will help us build a better experience for you.
Help us improve this page


 English (US) ·