

An overwhelming majority of sellers are cashing in on booming property conditions, but there are concerns recent buyers could be in for tougher times ahead.
Analysis of property sales on realestate.com.au has revealed a staggering proportion of vendors who sold their home in the past 12 months got a higher price than what they previously paid, with some locations recording jackpot-sized profits.
While rising interest rates and post-budget jitters have taken some steam out of the market, realestate.com.au senior economist Eleanor Creagh said overall, loss-making resales remain extremely rare.
“Repeat sales analysis shows that the vast majority of homeowners continue to sell at a profit,” Ms Creagh said.
“In some of the strongest performing regions more than 99% of resales are profitable, reflecting the depth of price growth over recent years.”
PropTrack data shows home prices have doubled in Perth, Brisbane and Adelaide in the past five years, but even in markets where price growth has been more contained – such as Melbourne (9% five-year growth), Canberra (19%) and Sydney (24%) - median gains are often still in the hundreds of thousands of dollars.
Top 10 regions where median resale profits are highest
| Region (SA4) | State | Profitable | Median profit ($) | |
| 1 | Sydney - Northern Beaches | NSW | 96.3% | $810,000 |
| 2 | Sydney - Eastern Suburbs | NSW | 96.2% | $779,000 |
| 3 | Sydney - Baulkham Hills and Hawkesbury | NSW | 94.8% | $750,000 |
| 4 | Brisbane - West | QLD | 99.5% | $640,000 |
| 5 | Brisbane - South | QLD | 99.8% | $578,500 |
| 6 | Sunshine Coast | QLD | 99.3% | $565,000 |
| 7 | Brisbane - East | QLD | 99.7% | $556,000 |
| 8 | Gold Coast | QLD | 99.5% | $550,000 |
| 9 | Sydney - Sutherland | NSW | 97.7% | $527,000 |
| 10 | Brisbane - North | QLD | 99.9% | $520,000 |
Jump ahead to see where resale profits are strongest in every state and territory.
Sellers in Sydney’s northern beaches topped the list nationally, with a typical sale delivering vendors a windfall gain of around $810,000. More than 96% of homes resold for a gain.
Real estate agent Laura Mears from McGrath Pittwater and Avalon Beach said holiday homes account for a large cohort of buyers and sellers in her northern beaches pocket.
Despite a pullback in momentum on the back of the recent interest rate rises, Ms Mears said most sellers would opt to sit tight rather than sell for a lower price.
"A lot of the people that own these homes, they're successful and they certainly don't have any financial reason to sell," she said.
"A lot of owners will not sell unless they get their price, they'll just hold their properties."
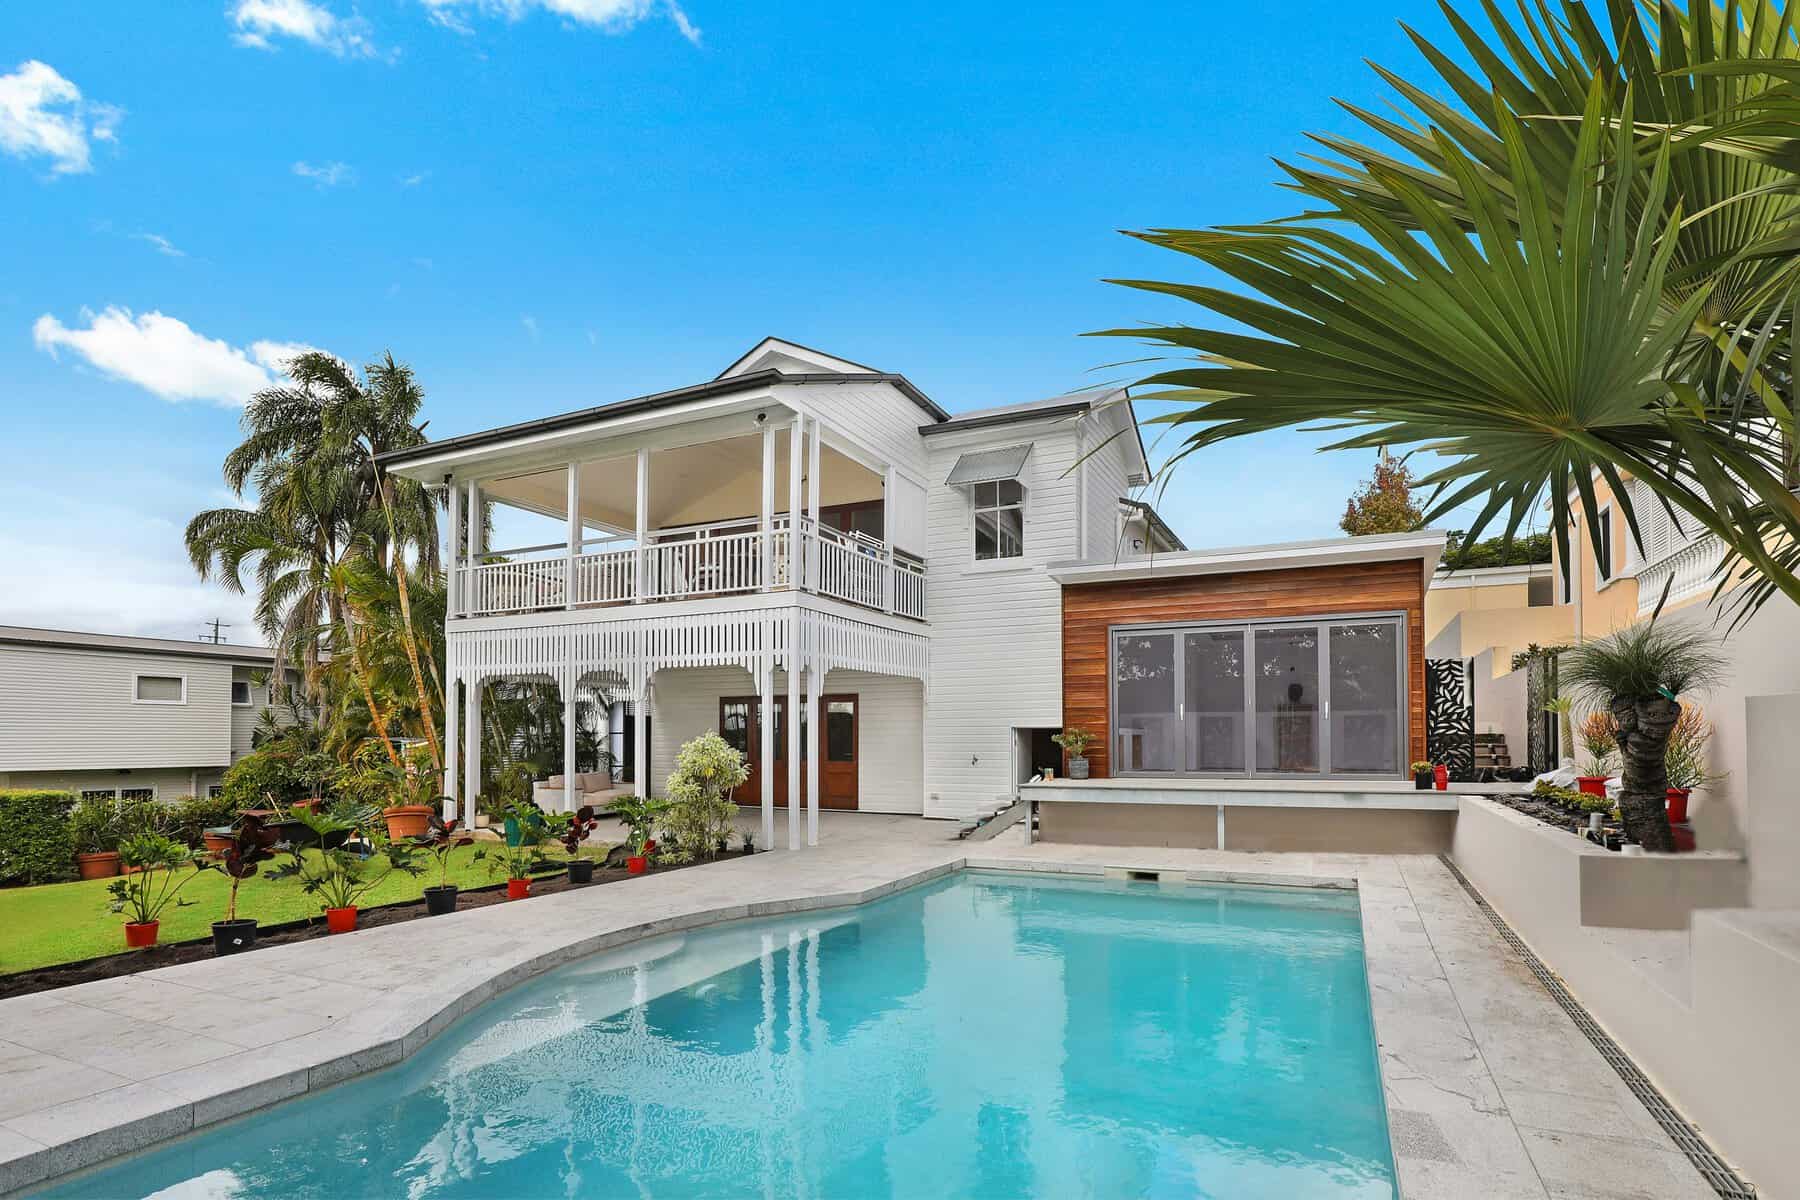
Sellers in Sydney's affluent northern beaches have recorded the largest resale gains over the 12 months to April. Picture: realestate.com.au/sold
Sydney accounted for four of the top ten most profitable hotspots across the country, with sellers in the affluent eastern suburbs pocketing around $779,000 more than their previous purchase price, followed by north-west suburbs within the Baulkham Hills and Hawkesbury region.
Sutherland in Sydney’s south, which captures many waterfront and coastal suburbs, saw a median resale profit of $527,000.
Queensland made up the rest of the top ten list for resale profits in dollar terms, and also dominated when looking at the proportion of total sales where homeowners resold for a higher price.
Almost all sellers across Greater Brisbane, as well as parts of Perth and Adelaide, recorded a resale profit, which Ms Creagh said reflected the rapid price growth in recent years more than compensating for periods of little-to-no growth pre-Covid.
Top 10 regions by share of profitable resales
| Region (SA4) | State | Profitable | Median profit ($) | |
| 1 | Brisbane - North | QLD | 99.9% | $520,000 |
| 2 | Moreton Bay - South | QLD | 99.9% | $502,500 |
| 3 | Logan - Beaudesert | QLD | 99.8% | $470,000 |
| 4 | Toowoomba | QLD | 99.8% | $419,000 |
| 5 | Perth - North West | WA | 99.8% | $475,000 |
| 6 | Brisbane - South | QLD | 99.8% | $578,500 |
| 7 | Brisbane - East | QLD | 99.7% | $556,000 |
| 8 | Adelaide - North | SA | 99.7% | $415,000 |
| 9 | Brisbane Inner City | QLD | 99.7% | $442,500 |
| 10 | Perth - North East | WA | 99.6% | $425,000 |
Brisbane agent Andrew King from Ray White Everton Park said most owners who purchased since Covid were selling for at least 50-60% more than what they paid.
"I started [in real estate] in the GFC, and a lot of people sold for less than what they paid for it, that was just quite normal. But I haven't seen anyone selling for less than what they paid for something for a decade or more," Mr King said.
He pointed to the recent sale of a knockdown property at 56 Gearside Street, which sold for $1.27 million in April - $330,000 more than just 15 months earlier - without any work being done on the property.
"It was a stock-standard post war home on a 600 square metre block. There was nothing fancy or flash about it."
56 Gearside Street, Everton Park recently sold to a developer for $1.27m, $330k more than just 15 months earlier. Picture: realestate.com.au/sold
He said while a shortage of supply would continue to underpin the Brisbane market, interest rate rises and uncertainty around the federal budget measures had caused enquiry levels to pull back, with many homeowners opting to sit tight rather than transact.
"I think [the Brisbane market has experienced] a unicorn set of circumstances, and I would say it'll be a long time before we probably see that much growth in such a short amount of time again."
The analysis looks at properties resold over the 12 months to April, regardless of when they were originally purchased. This means gains and losses are measured across a range of holding periods, from recent buyers to long-term owners.
While the figures represent eyewatering gains for many homeowners, the data does not capture things like stamp duty, holding costs or renovations and maintenance outlays that would eat into the seller’s total return.
Jump ahead to see the top regions for resale profits in:
- New South Wales
- Victoria
- Queensland
- Western Australia
- South Australia
- Tasmania
- Northern Territory
- ACT
Equity gains provide buffer in cooling conditions
According to data from the Reserve Bank of Australia, fewer than 1% of borrowers are currently in negative equity.
That will likely cushion the blow of a potential property market correction, Ms Creagh said, with national home values dipping 0.1% in April for the first time this year.
“These equity gains are an important stabiliser for the housing market, helping many existing owners absorb higher interest rates without needing to sell under pressure,” she said.
But that doesn’t mean everyone is in a strong equity position.
Investors and first-home buyers piled into the property market over the back half of 2025 as factors like a fear-of-missing-out and expanded government support boosted market activity.
Ms Creagh said these buyers who’ve yet to build up substantial equity buffers will likely bear the brunt of worsening affordability and cooling property values.
“The risks centre around those with relatively new mortgages who stretched themselves expecting income gains,” she said.
“More rate sensitive segments, particularly higher priced premium pockets, investor exposed or highly leveraged markets are more vulnerable to price falls.”
Sellers in Sydney's Northern Beaches region have recorded huge resale gains over the past 12 months. Picture: Getty
It comes as several banks downgrade their forecasts for property price growth in the year ahead.
In a note on Tuesday, Economists at Westpac said the proposed budget changes could slash new investor activity by around a third in the near-term, and reduce total housing turnover across all buyer types by 20%.
Property price growth is now expected to remain flat across the major capital cities over 2026, down from its previous forecast of 5% growth.
Sydney and Melbourne are expected to take the largest hit, with prices tipped to decline by 3% and 4% this year, respectively. However, Brisbane (9% growth forecast), Perth (13%) and Adelaide (7%) are projected to grow.
Westpac's revised home price growth forecasts:
| 2025 (actual) | 2026 (forecast) | 2027 (forecast) | |
| Sydney | 6.4% | -3% | 2% |
| Melbourne | 4.5% | -4% | 5% |
| Brisbane | 14.6% | 9% | 3% |
| Perth | 17.2% | 13% | 5% |
| Adelaide | 12.8% | 7% | 4% |
| Australia | 8.8% | 1% | 3% |
“The changes to capital gains tax and negative gearing remove the relative attractiveness of new investment in housing,” Westpac chief economist Luci Ellis said.
“There is some risk of housing markets encountering an ‘air pocket’ short term. Lower turnover and uncertainty about the impacts of the tax policy changes mean we could see sharper price movements, particularly with the RBA also expected to raise interest rates further in the second half of the year.”
ANZ and CBA have both revised their housing outlooks in recent weeks, with particular segments of the market tipped to be more exposed.
Outer fringe and apartment-dense inner city pockets could see the biggest impact from a reduction in investor activity. Picture: Getty
For example, markets with a larger proportion of rental stock – such as apartment-dense inner-city pockets and more affordable outer-fringe suburbs, which tend to attract investors.
“This is not a typical downturn,” Ms Creagh said. “What distinguishes the current cycle is the strength of household balance sheets.
“Rather than forcing widespread distressed selling, and large price falls, strong equity bufers allow households to absorb higher servicing costs by reducing consumption, drawing on savings, refinancing, loan top ups, or simply holding their property.”
Top resale profits in each state and territory
The data captures Australia’s SA4 regions, which is a geographical area defined by the Australian Bureau of Statistics (ABS), which is usually larger than a local government area (LGA) and has a population of between 100,000 and 500,000 people.
SA4 regions may vary in size from one part of a capital city to a less densely-populated corner of a state. There is just one SA4 region in the ACT and two in the Northern Territory, compared to 30 in New South Wales.
New South Wales
| Region (SA4) | Profitable | Median profit ($) | |
| 1 | Sydney - Northern Beaches | 96.3% | $810,000 |
| 2 | Sydney - Eastern Suburbs | 96.2% | $779,000 |
| 3 | Sydney - Baulkham Hills and Hawkesbury | 94.8% | $750,000 |
| 4 | Sydney - Sutherland | 97.7% | $527,000 |
| 5 | Central Coast | 97.8% | $473,500 |
| 6 | Sydney - Outer South West | 98.4% | $470,000 |
| 7 | Sydney - North Sydney and Hornsby | 92.8% | $455,000 |
| 8 | Richmond - Tweed | 95.7% | $453,000 |
| 9 | Sydney - Outer West and Blue Mountains | 98.1% | $447,000 |
| 10 | Newcastle and Lake Macquarie | 98.3% | $437,000 |
Victoria
| Region (SA4) | Profitable | Median profit ($) | |
| 1 | Mornington Peninsula | 95.0% | $360,000 |
| 2 | Melbourne - Outer East | 95.3% | $320,000 |
| 3 | Bendigo | 97.2% | $265,000 |
| 4 | Geelong | 93.9% | $261,000 |
| 5 | Melbourne - South East | 95.6% | $260,000 |
| 6 | Hume | 97.3% | $255,000 |
| 7 | Melbourne - Inner East | 81.8% | $243,000 |
| 8 | Melbourne - North East | 94.5% | $240,000 |
| 9 | Melbourne - Inner South | 86.7% | $231,000 |
| 10 | Shepparton | 96.9% | $221,500 |
Queensland
| Region (SA4) | Profitable | Median profit ($) | |
| 1 | Brisbane - West | 99.5% | $640,000 |
| 2 | Brisbane - South | 99.8% | $578,500 |
| 3 | Sunshine Coast | 99.3% | $565,000 |
| 4 | Brisbane - East | 99.7% | $556,000 |
| 5 | Gold Coast | 99.5% | $550,000 |
| 6 | Brisbane - North | 99.9% | $520,000 |
| 7 | Moreton Bay - South | 99.9% | $502,500 |
| 8 | Moreton Bay - North | 99.6% | $472,000 |
| 9 | Logan - Beaudesert | 99.8% | $470,000 |
| 10 | Ipswich | 99.6% | $455,000 |
Western Australia
| Region (SA4) | Profitable | Median profit ($) | |
| 1 | Perth - North West | 99.8% | $475,000 |
| 2 | Perth - South West | 99.6% | $445,000 |
| 3 | Perth - North East | 99.6% | $425,000 |
| 4 | Perth - South East | 99.5% | $415,000 |
| 5 | Mandurah | 99.3% | $380,000 |
| 6 | Bunbury | 99.0% | $380,000 |
| 7 | Western Australia - Wheat Belt | 98.2% | $300,000 |
| 8 | Perth - Inner | 95.8% | $275,000 |
| 9 | Western Australia - Outback (South) | 96.1% | $188,000 |
| 10 | Western Australia - Outback (North) | 77.9% | $156,000 |
South Australia
| Region (SA4) | Profitable | Median profit ($) | |
| 1 | Adelaide - South | 99.6% | $482,500 |
| 2 | Adelaide - Central and Hills | 99.4% | $460,000 |
| 3 | Adelaide - West | 99.2% | $430,000 |
| 4 | Adelaide - North | 99.7% | $415,000 |
| 5 | South Australia - South East | 99.5% | $305,000 |
| 6 | Barossa - Yorke - Mid North | 99.5% | $274,000 |
| 7 | South Australia - Outback | 92.2% | $140,000 |
Tasmania
| Region (SA4) | Profitable | Median profit ($) | |
| 1 | Hobart | 95.0% | $284,000 |
| 2 | Launceston and North East | 96.6% | $250,000 |
| 3 | South East | 94.3% | $242,500 |
| 4 | West and North West | 98.7% | $236,000 |
Northern Territory
| Region (SA4) | Profitable | Median profit ($) | |
| 1 | Darwin | 87.1% | $139,000 |
| 2 | Northern Territory - Outback | 72.5% | $40,000 |
ACT
| Region (SA4) | Profitable | Median profit ($) | |
| 1 | Australian Capital Territory | 93.3% | $291,000 |
Help us improve your reading experience
Got a minute? Your feedback will help us build a better experience for you.
Help us improve this page














 English (US) ·